Annualised growth in the shares of employment and hours worked of the representative low-paid jobs, Member States (%)
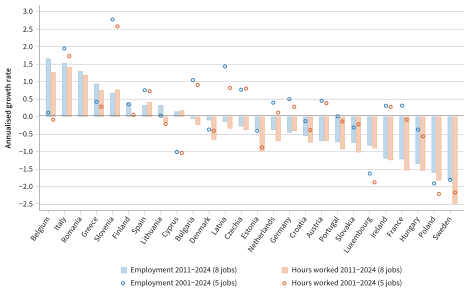
Notes: The bars represent annualised growth in the shares of employment and hours worked for the eight representative jobs between 2011 and 2024 (Member States are ranked from highest to lowest rate of change in employment), while the dots show annualised growth for the five jobs that can be followed over 2001–2024 (see Box 2 for an explanation of the two groups). As noted in Table A2 in Annex 1, several country–years are excluded due to breaks in the EU-LFS data series. Malta is excluded because it reports the occupation only at the ISCO one-digit level in the EU-LFS. In the case of Romania, the dots for 2001–2024 are omitted because changes in the occupational classification prevent consistent identification of the selected jobs over the full period.
Source: Authors’ calculations based on EU-LFS and SES data.
Related content
This data item featured in the following outputs.