Annualised growth in the share of hours worked for the bottom and top job–wage quintiles, EU and Member States, 2001–2024 (%)
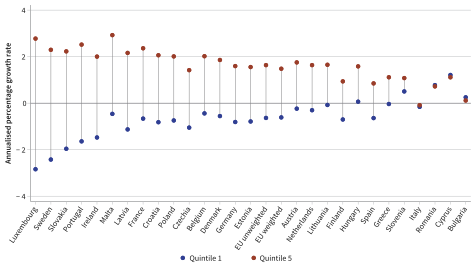
Notes: The y-axis shows the annualised percentage growth in the share of hours worked for the bottom and top quintiles over 2001–2024. This is calculated as a weighted average of the annualised growth rates in each subperiod, with weights based on the number of years. The trend over 2011–2024 is shown for Malta. In some cases, the actual period used differs slightly due to breaks in the EU-LFS employment classifications (see Table A2). EU values average the annualised growth rates across all Member States. The unweighted EU average treats all Member States the same, while the weighted average gives more weight to Member States with larger populations. Member States are sorted based on the difference between the growth rate for Quintile 1 and that for Quintile 5.
Source: Authors’ calculations based on EU-LFS and SES data.
Related content
This data item featured in the following outputs.